Graphic Facilitator · Seoul
My drawings begin with data.
I studied Human Resources Development (Industrial-Organizational Psychology) at Sungkyunkwan University. At KRIVET (Korea Research Institute for Vocational Education & Training), I managed data across 435 universities and identified a hidden national crisis — university departments had expanded from 2,300 to 23,500 entirely untracked, which led to a nationwide standardization project and an amendment to Korea's education administration law.
At Hanyang University, I designed the Personalized Education Matching System — analyzing student competency data to connect students with tailored academic pathways.
Working in complex multi-stakeholder environments, I began asking: why do people hear the same words and understand them so differently? That question led me to facilitation — and then to graphic facilitation.
Three Intersections
Higher Education Research
600K+ national records analyzed
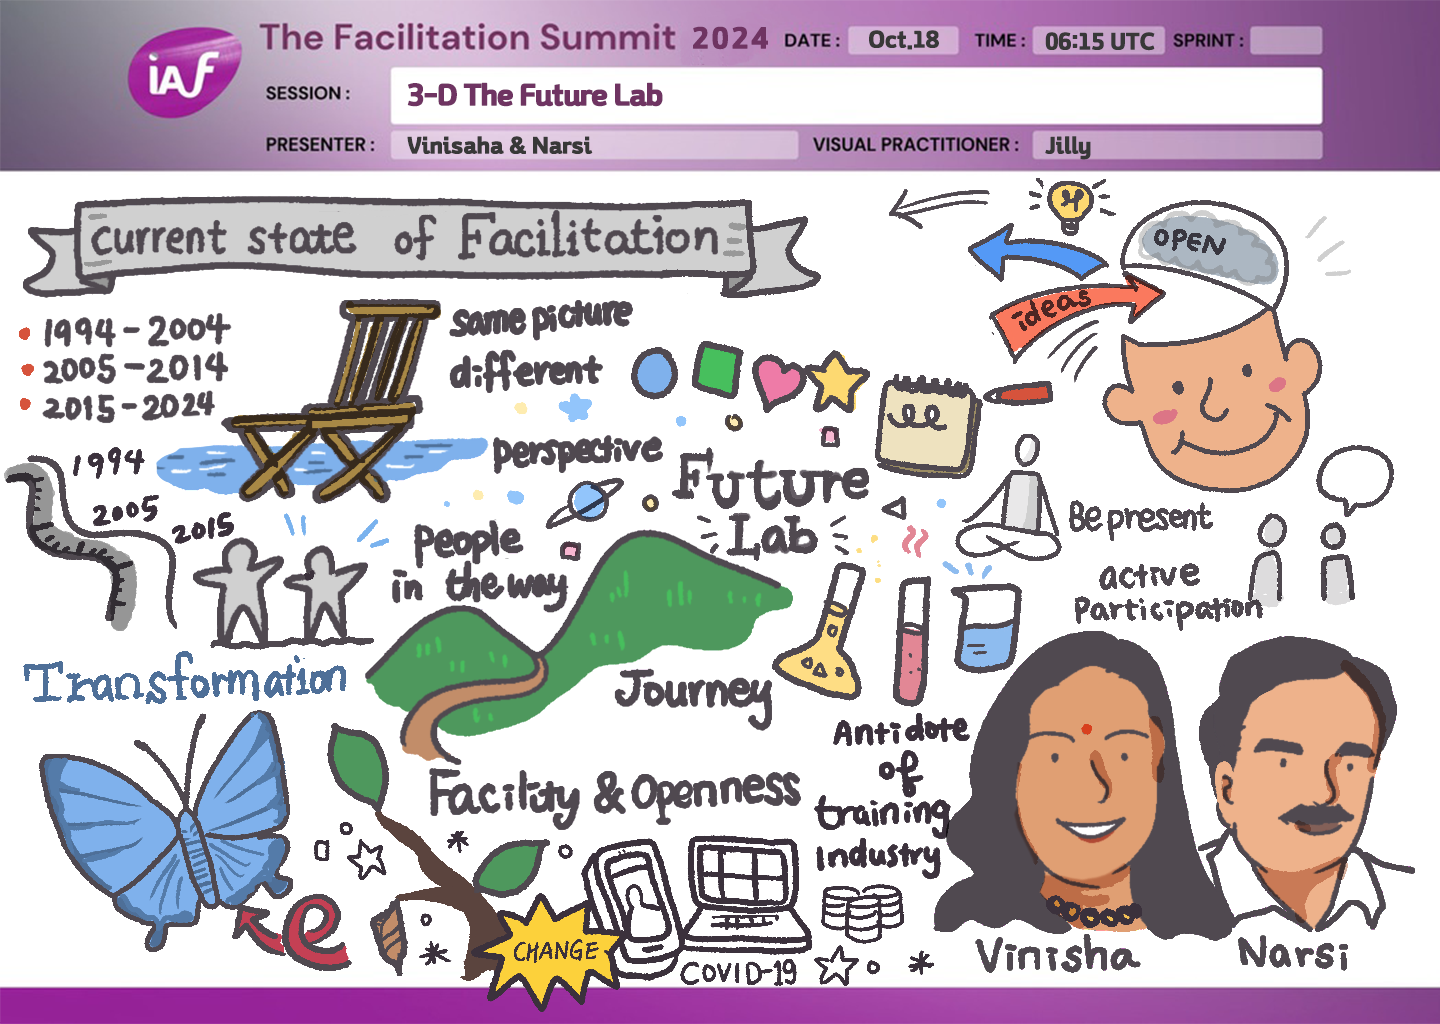
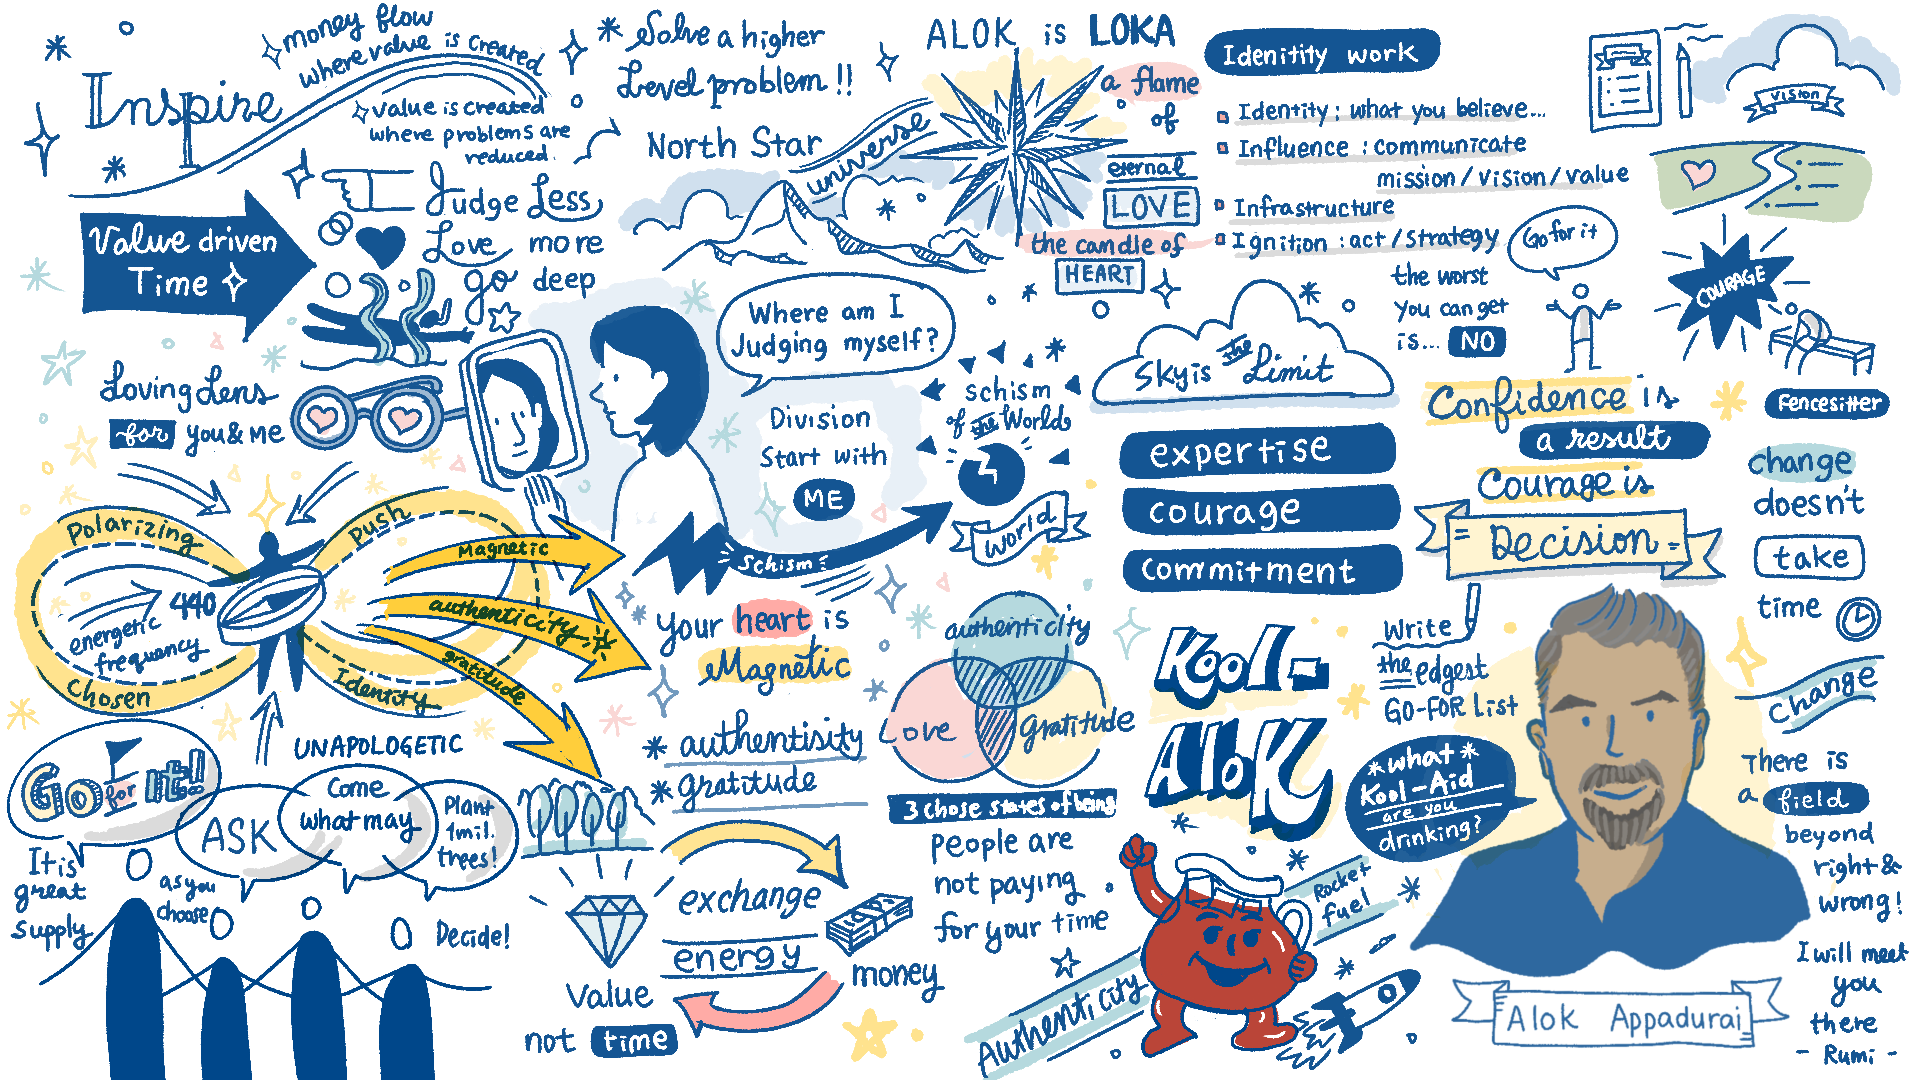
Graphic Facilitation
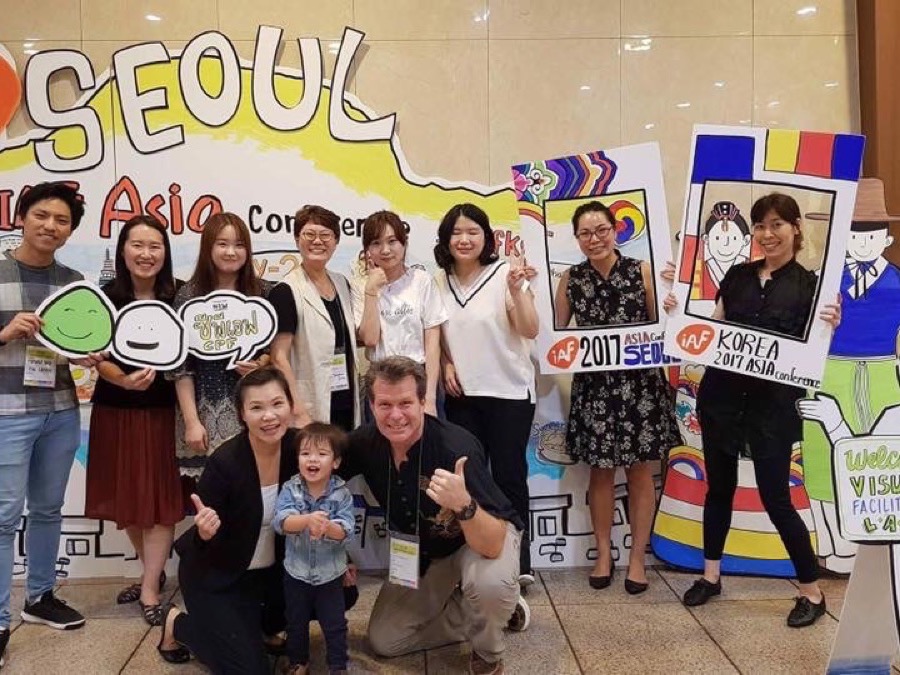
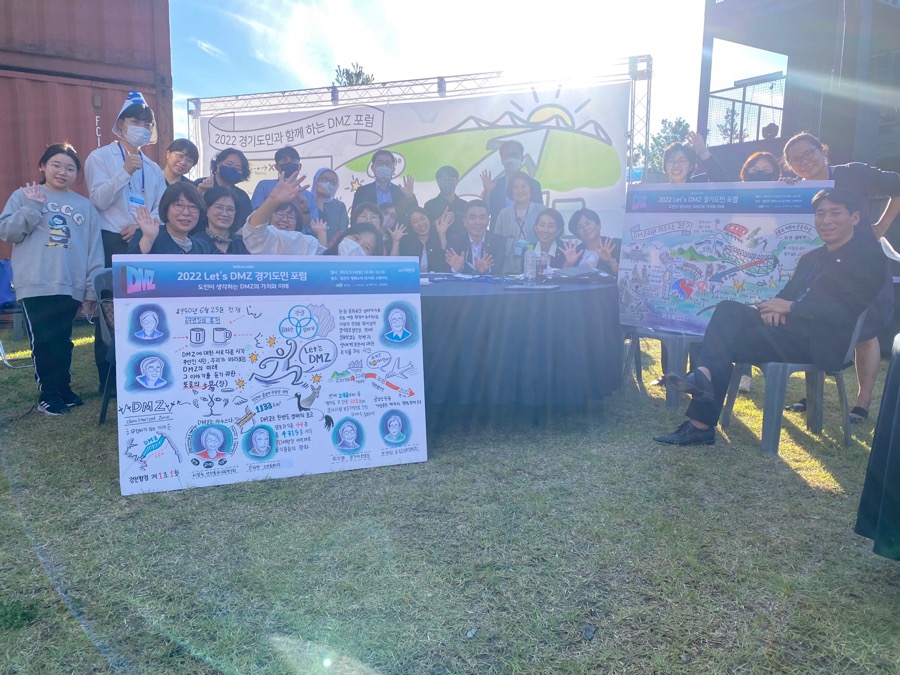
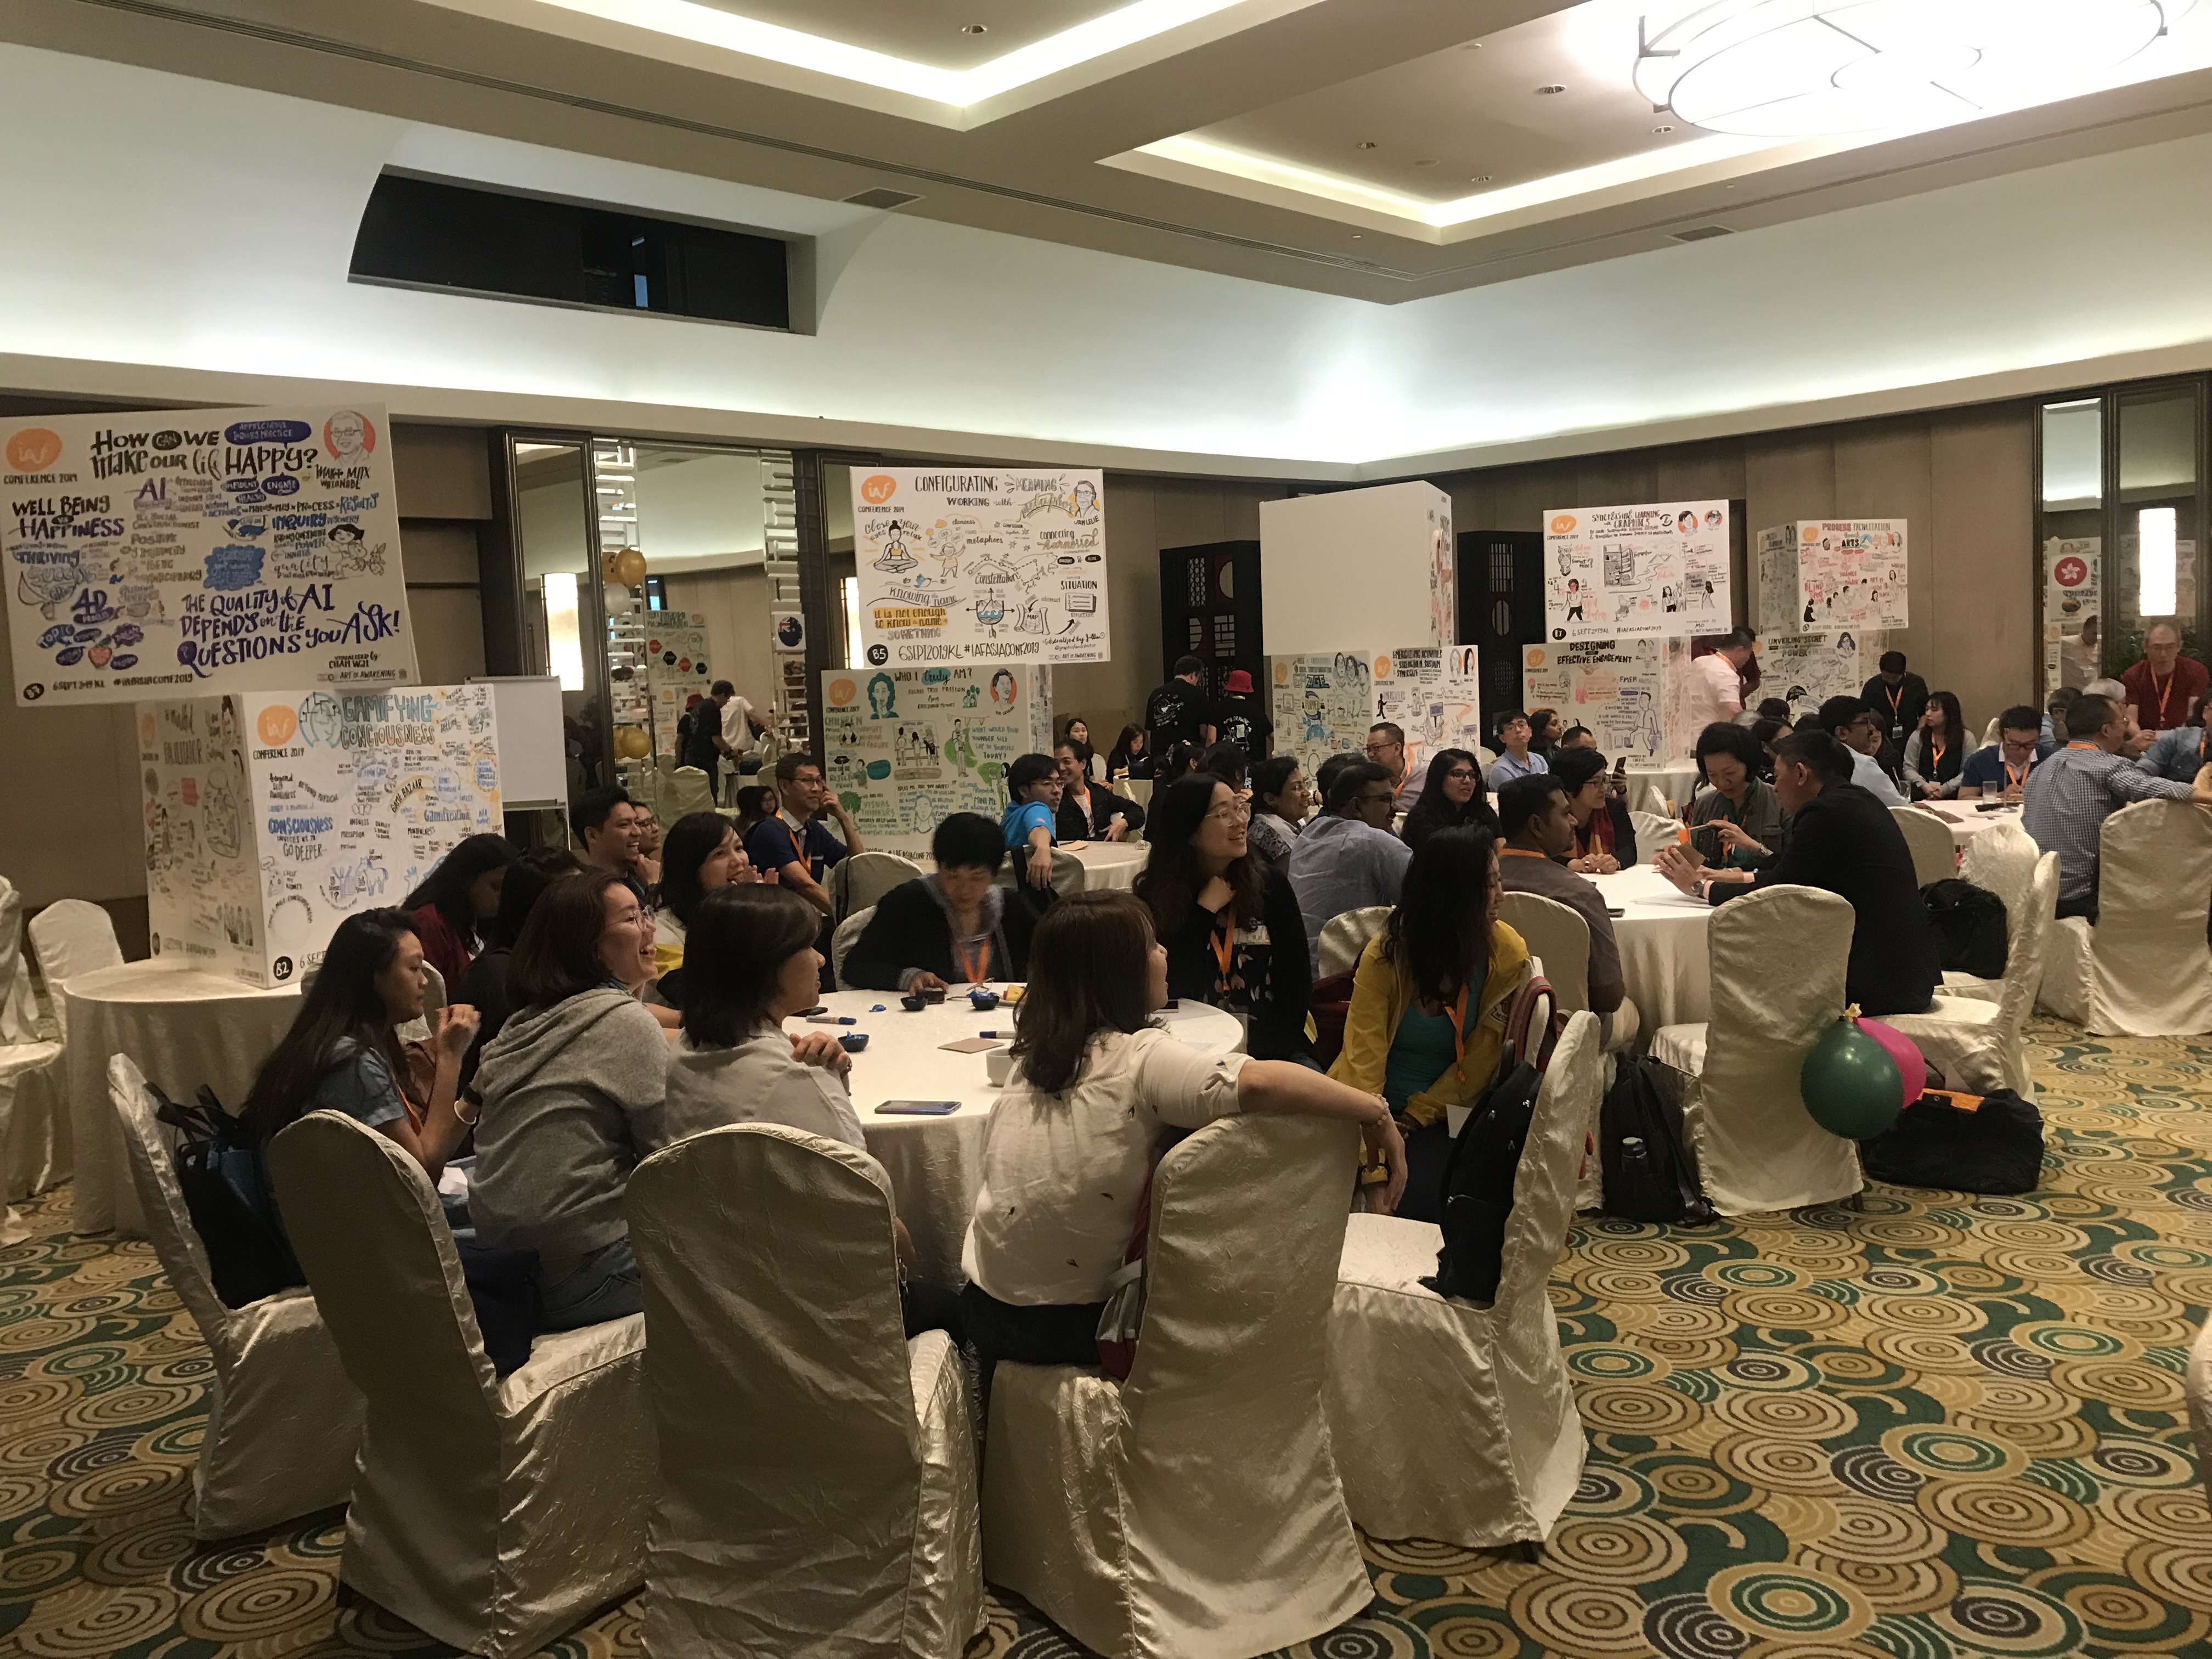
5,000+ global participants
AI × Visual
Collective intelligence research
Scientist Practitioner
My goal has always been to be a Scientist Practitioner — someone who builds bridges between research and practice.
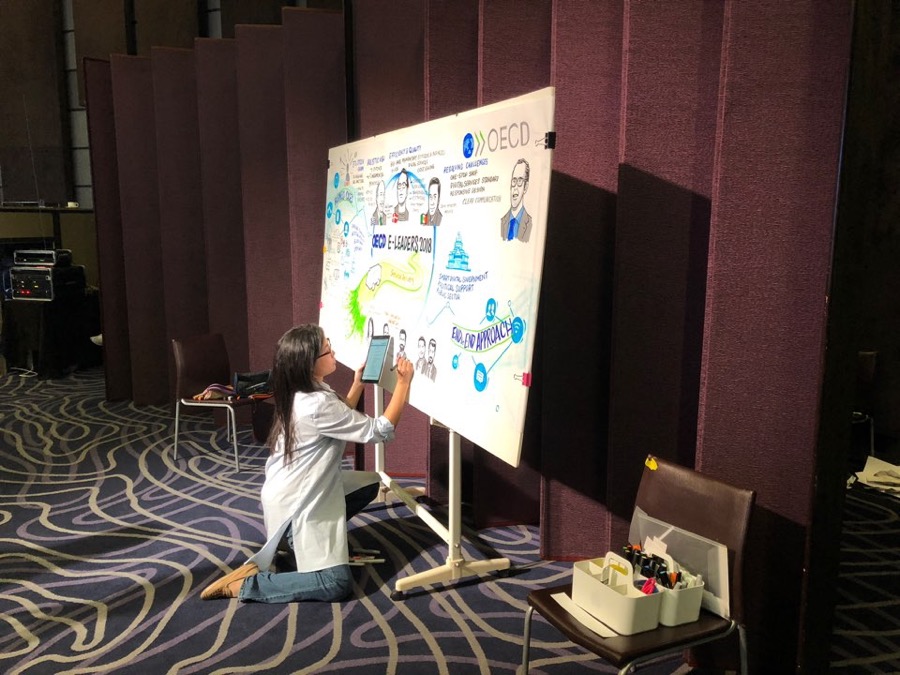
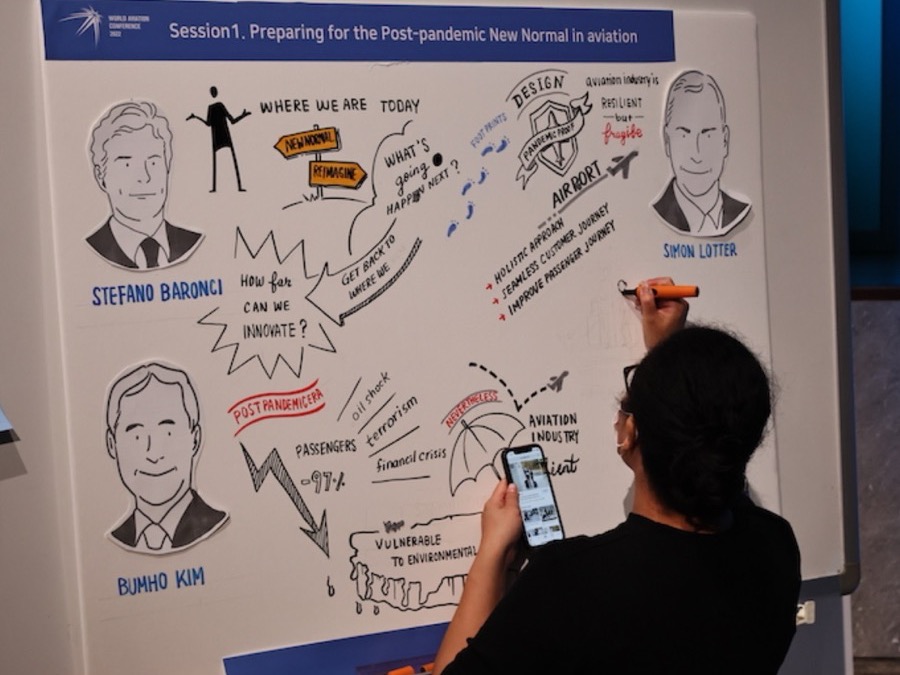
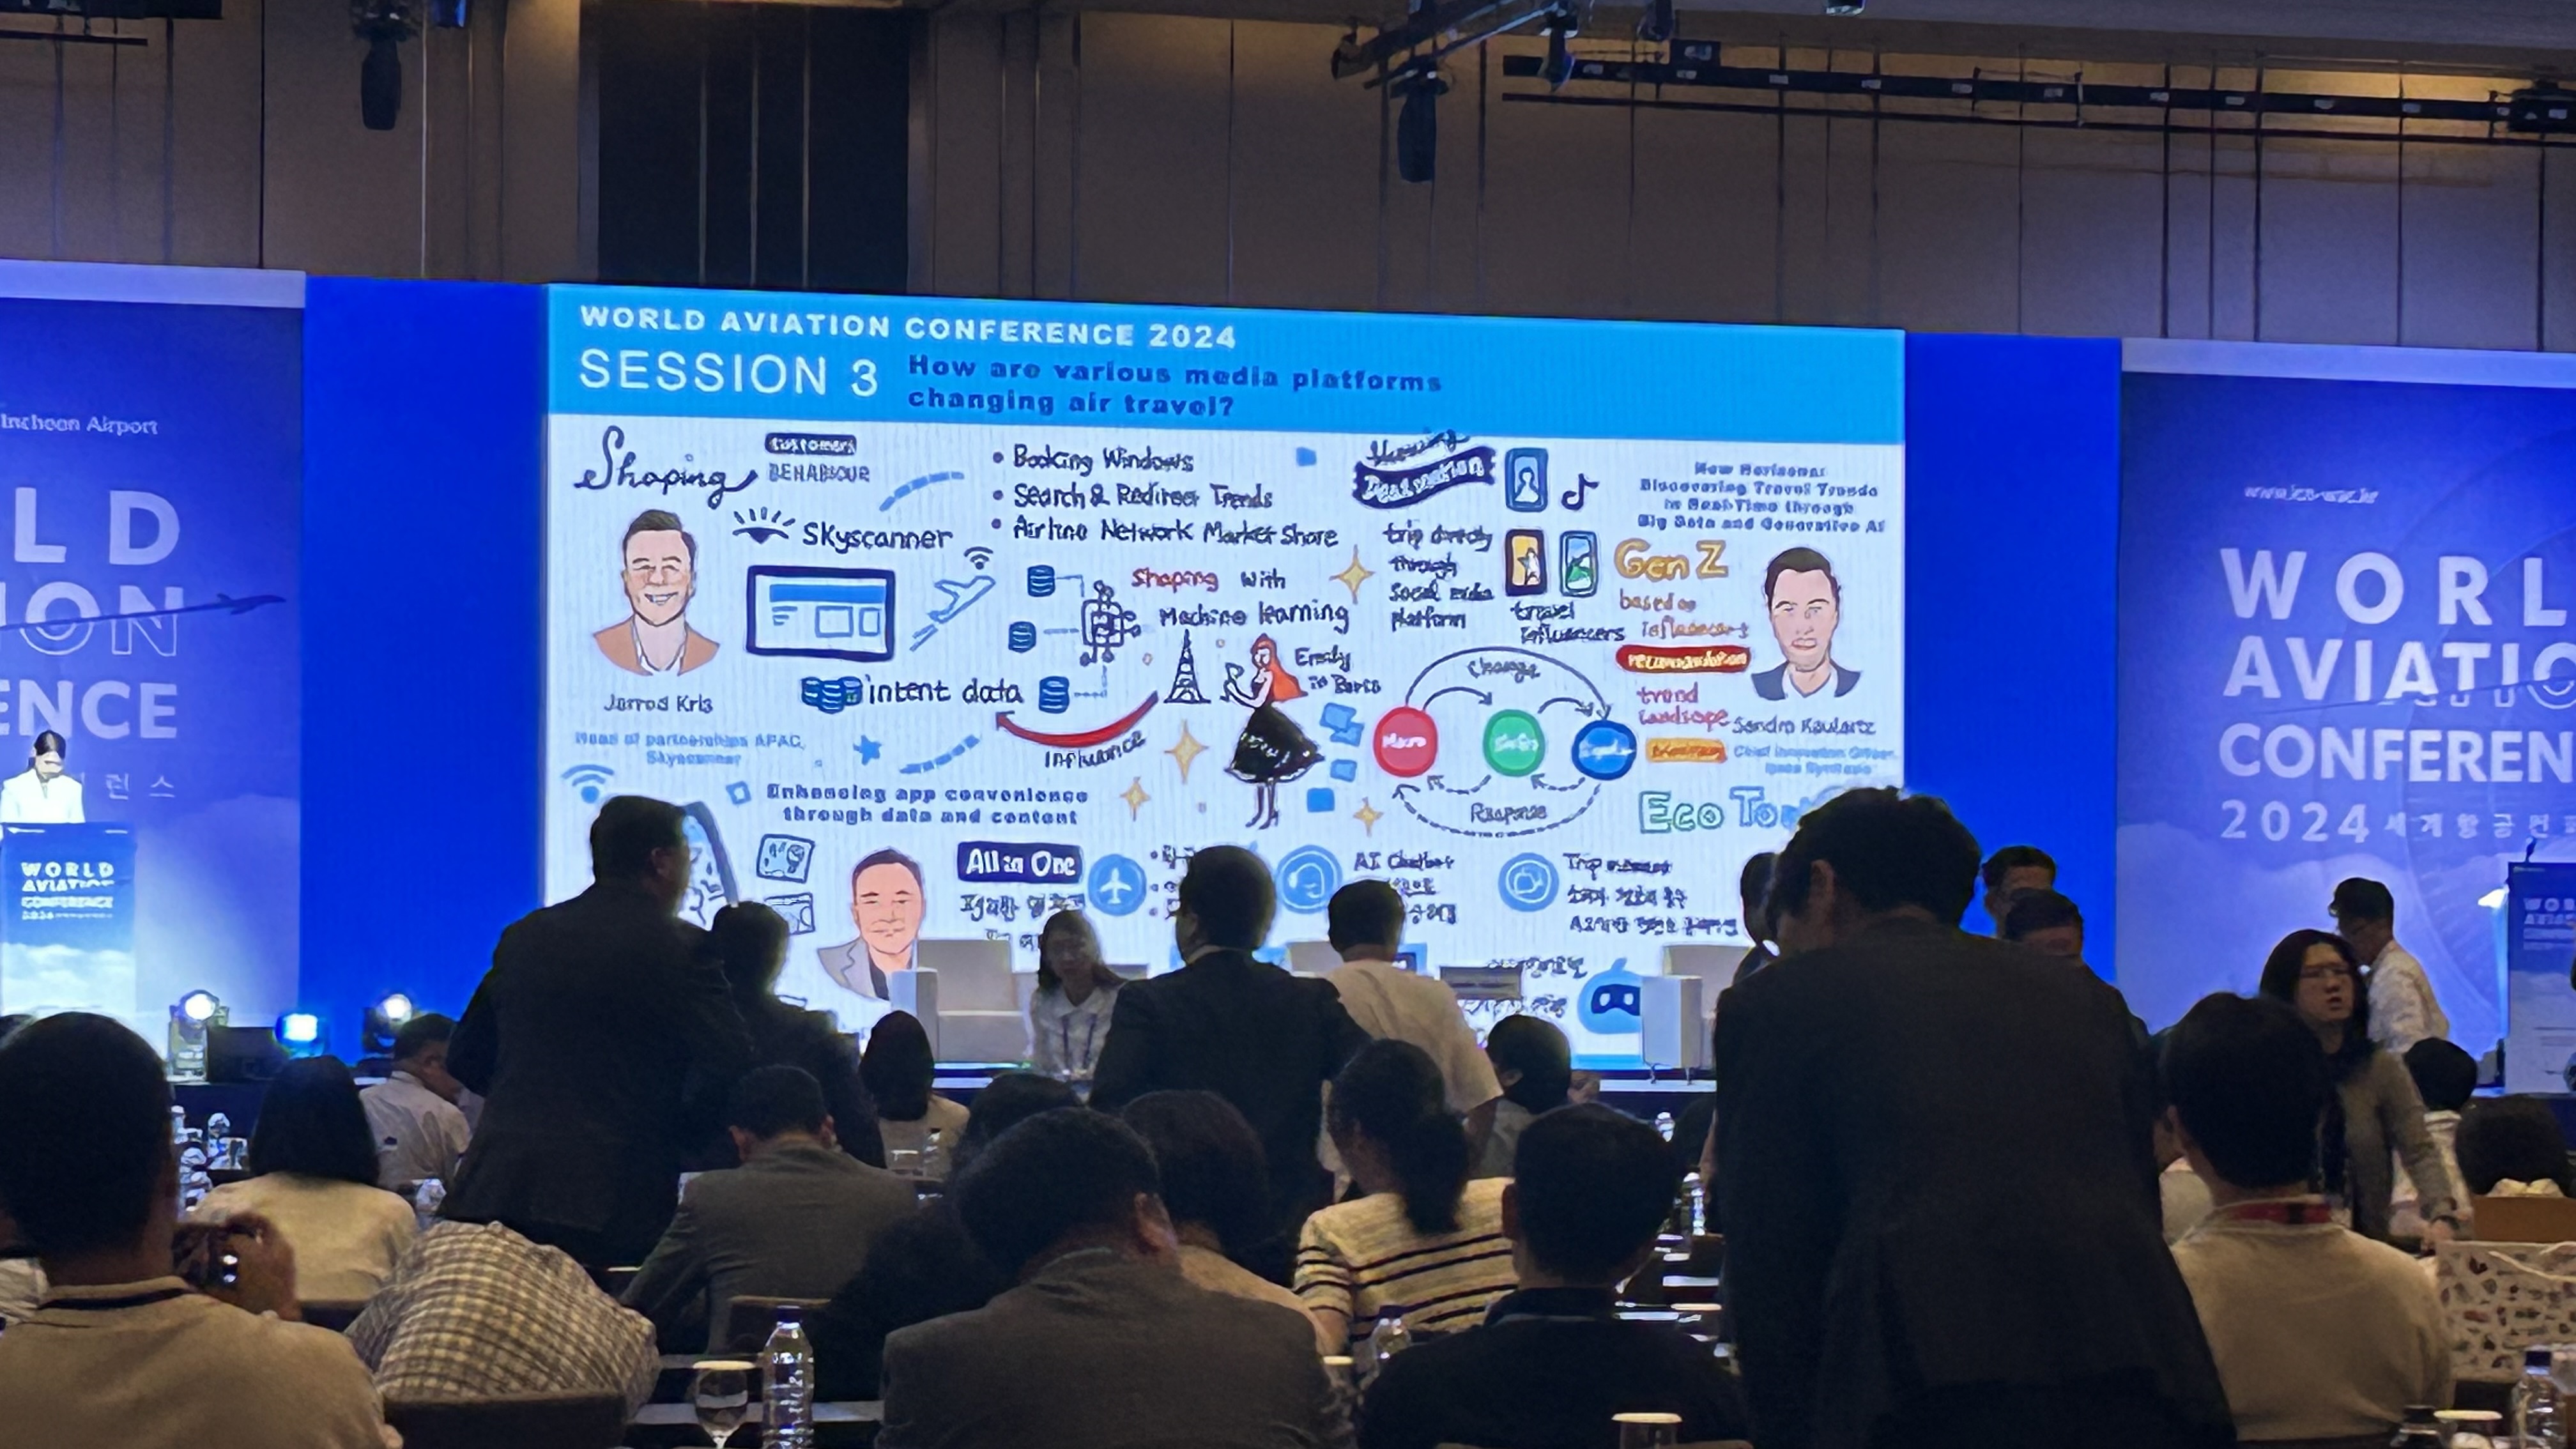
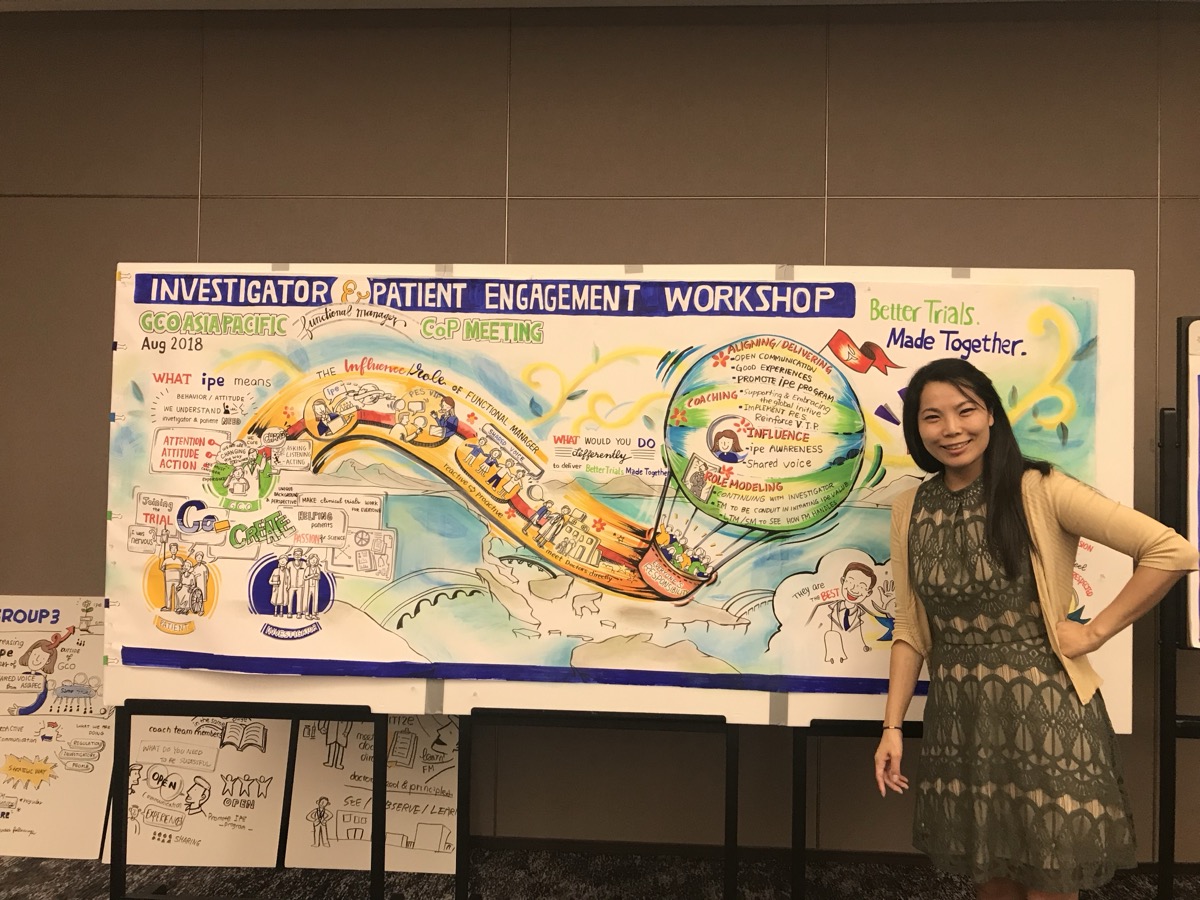
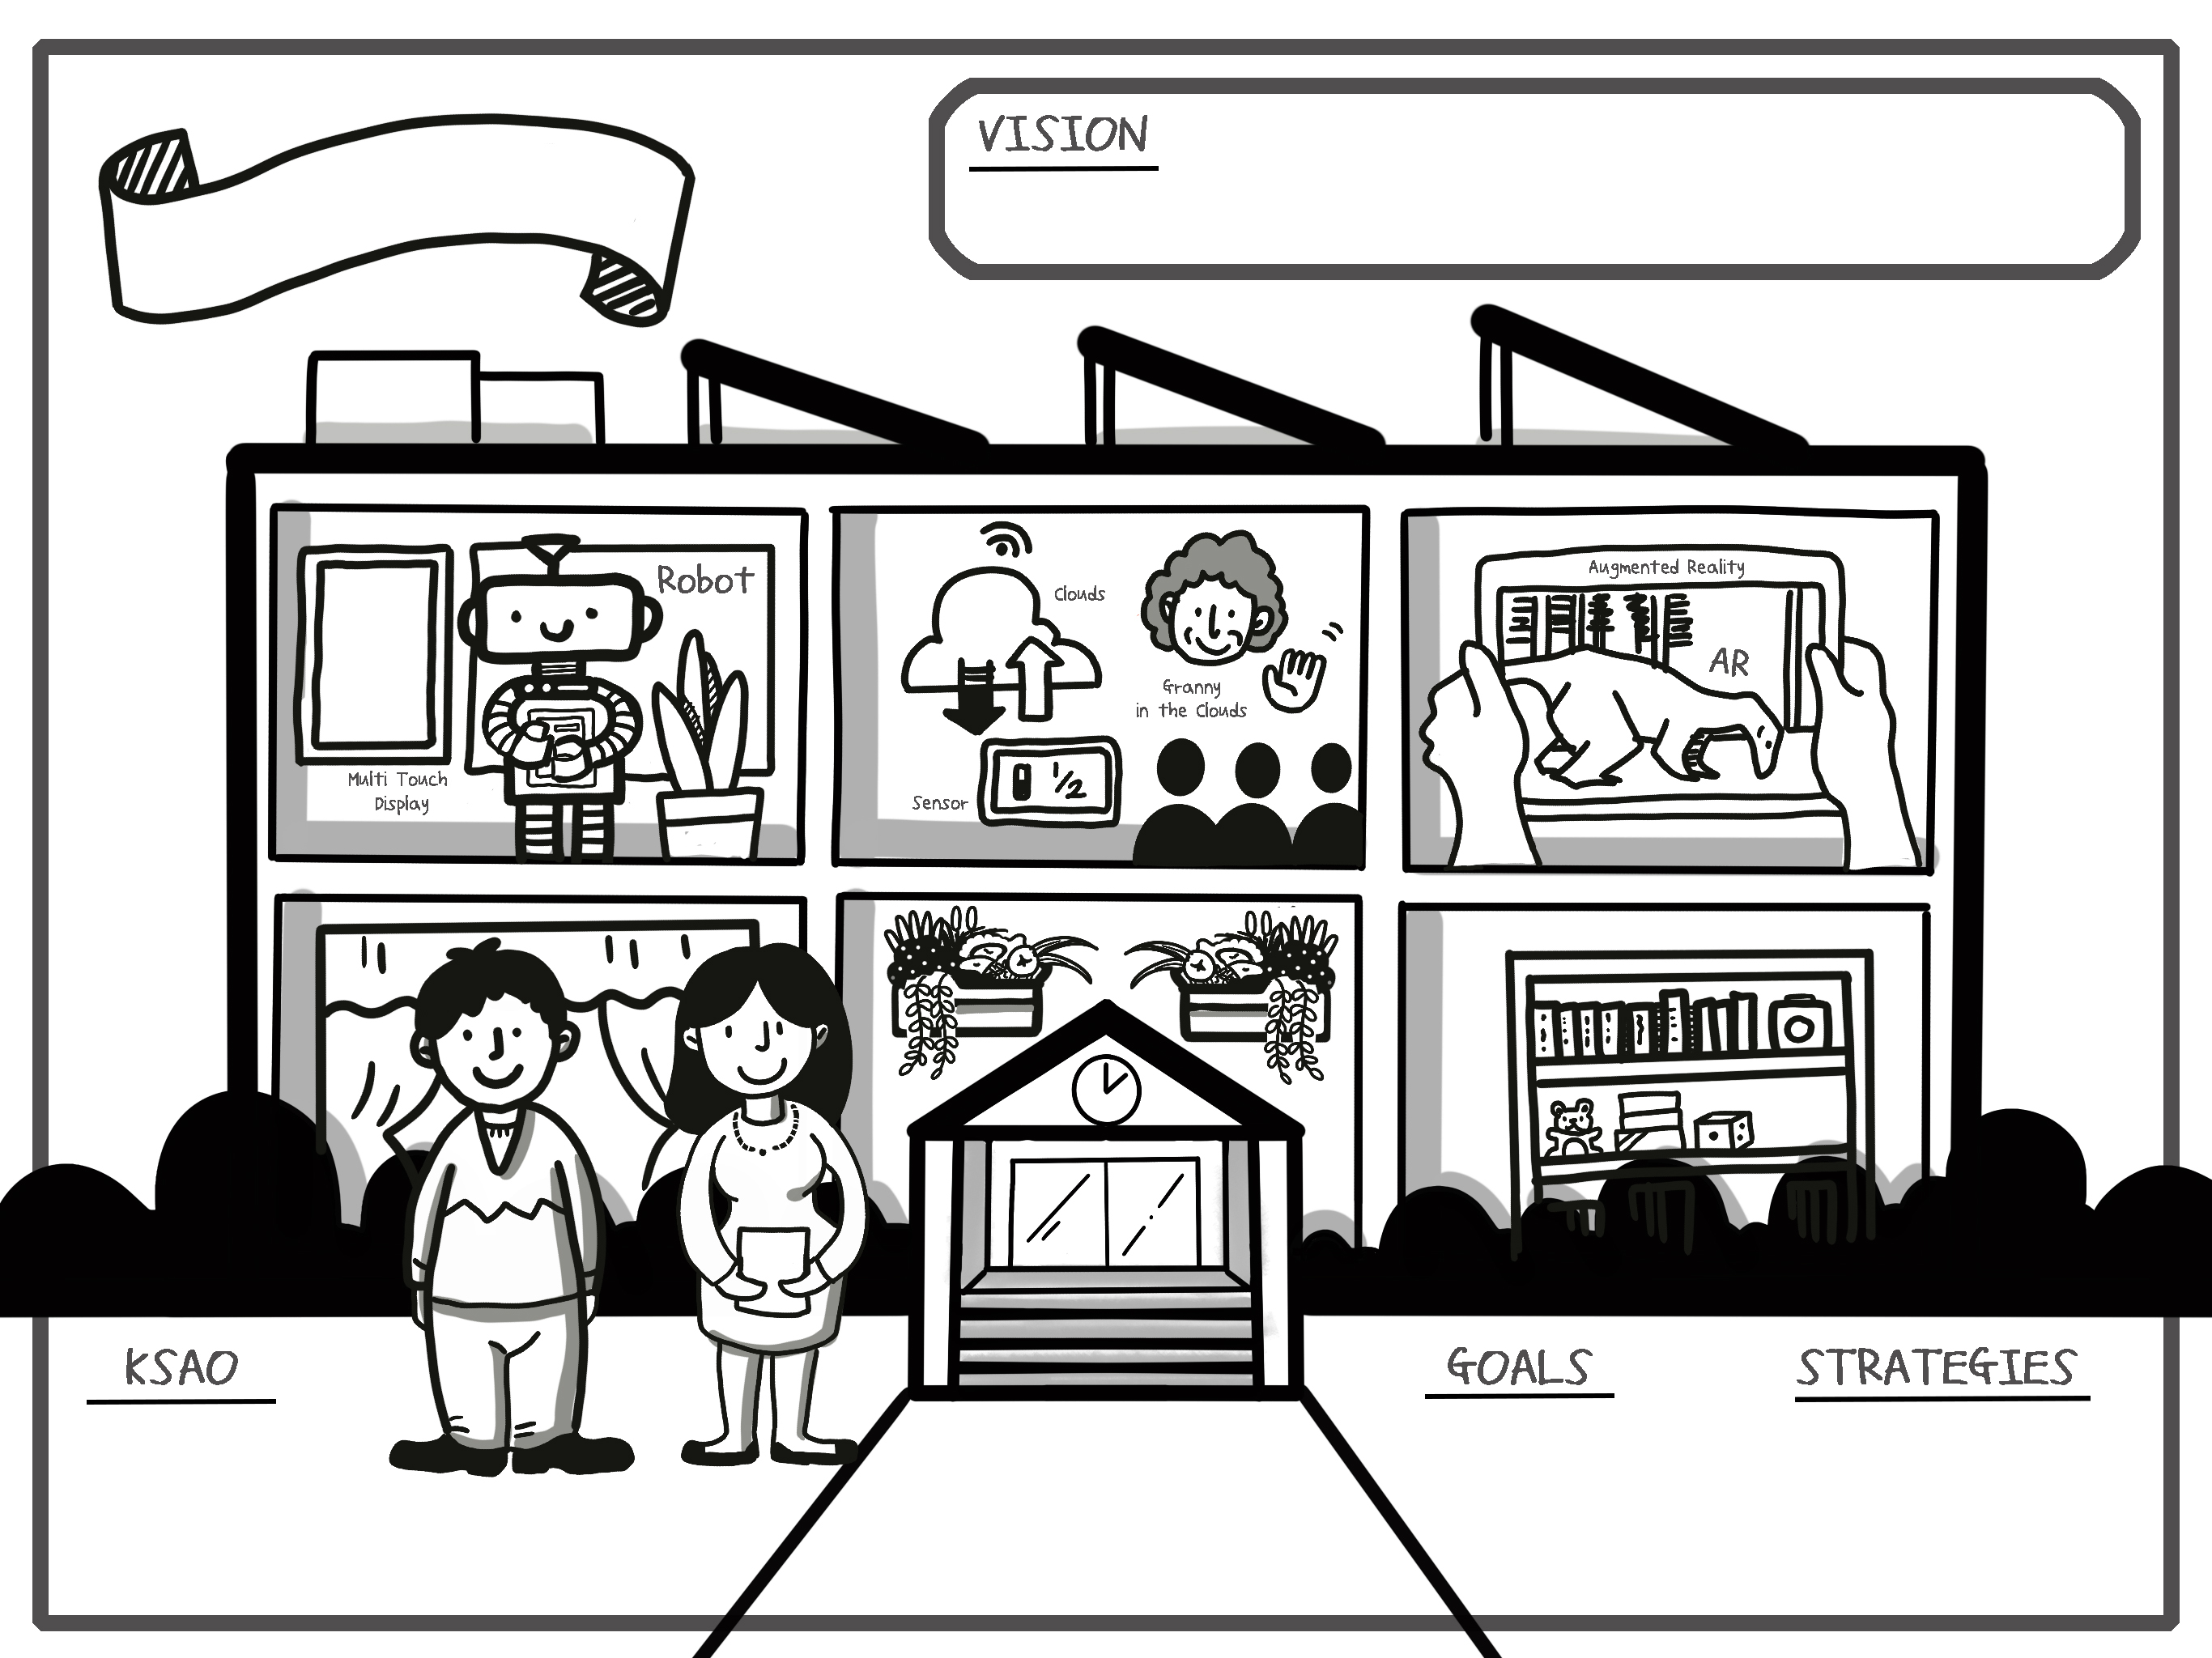
Graphic Facilitation is often confused with graphic design or illustration. In the field, it's sometimes treated as a vendor service. I've spent 10 years pushing back against that misunderstanding through the quality of the work itself.
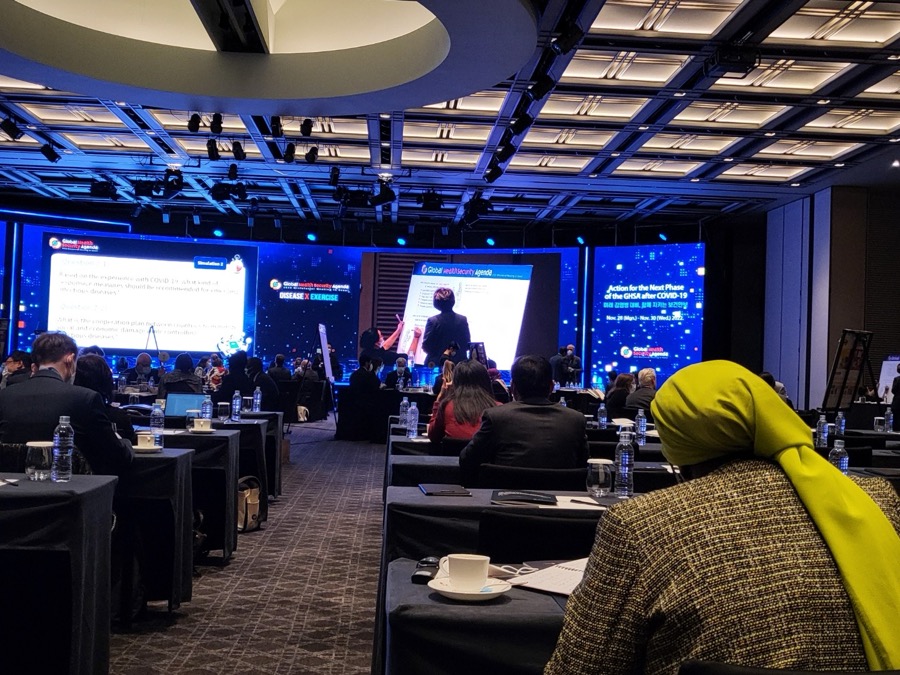
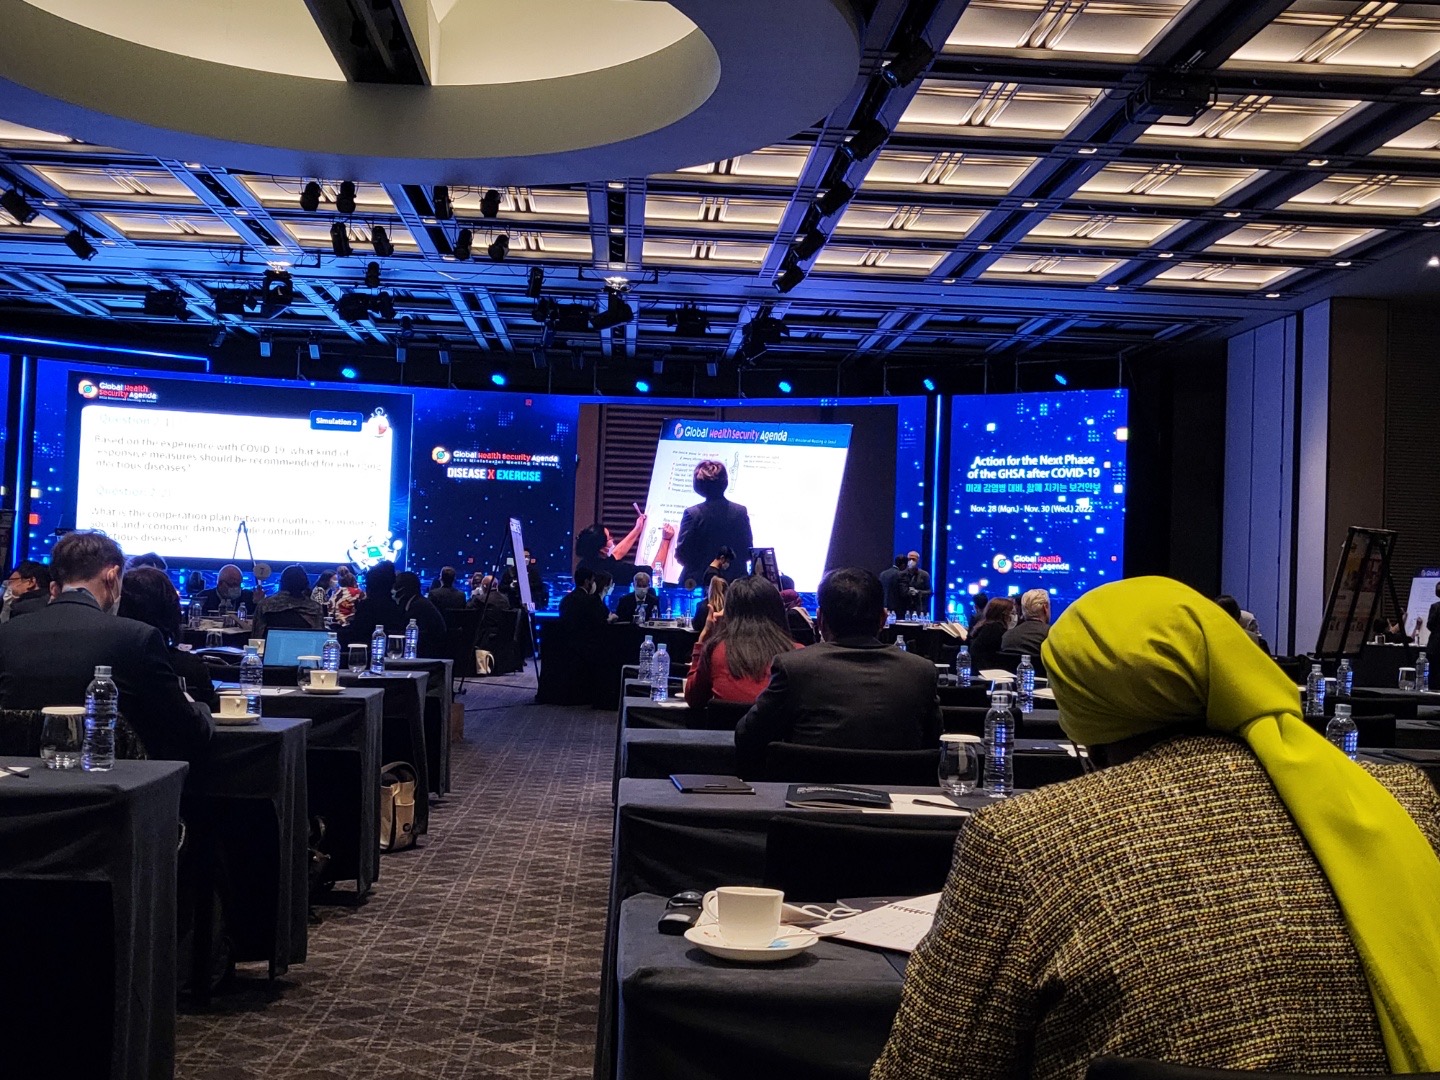
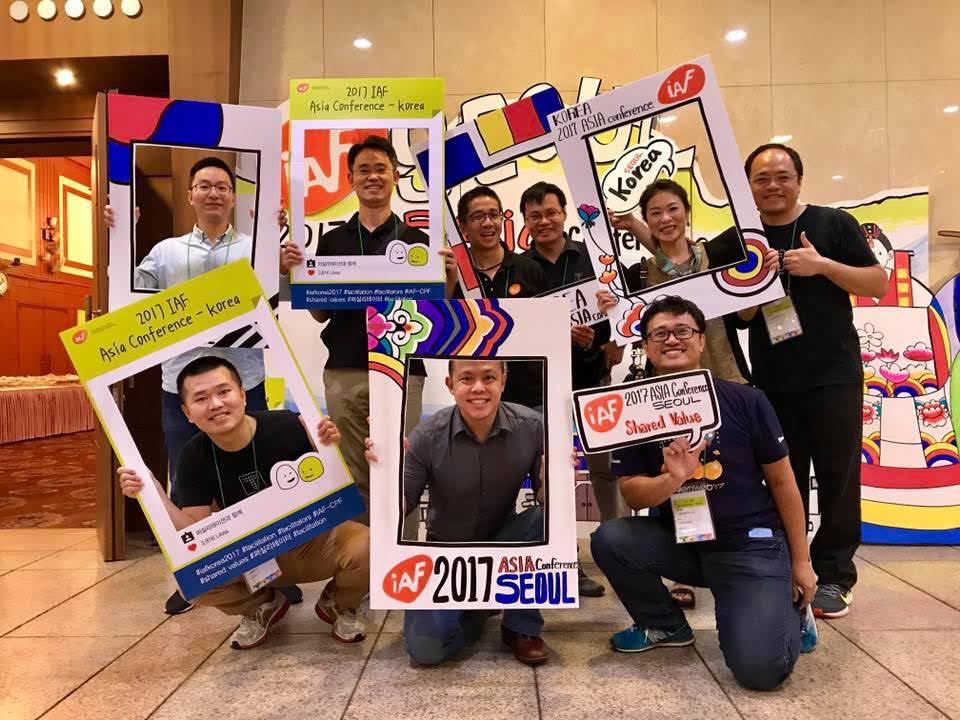
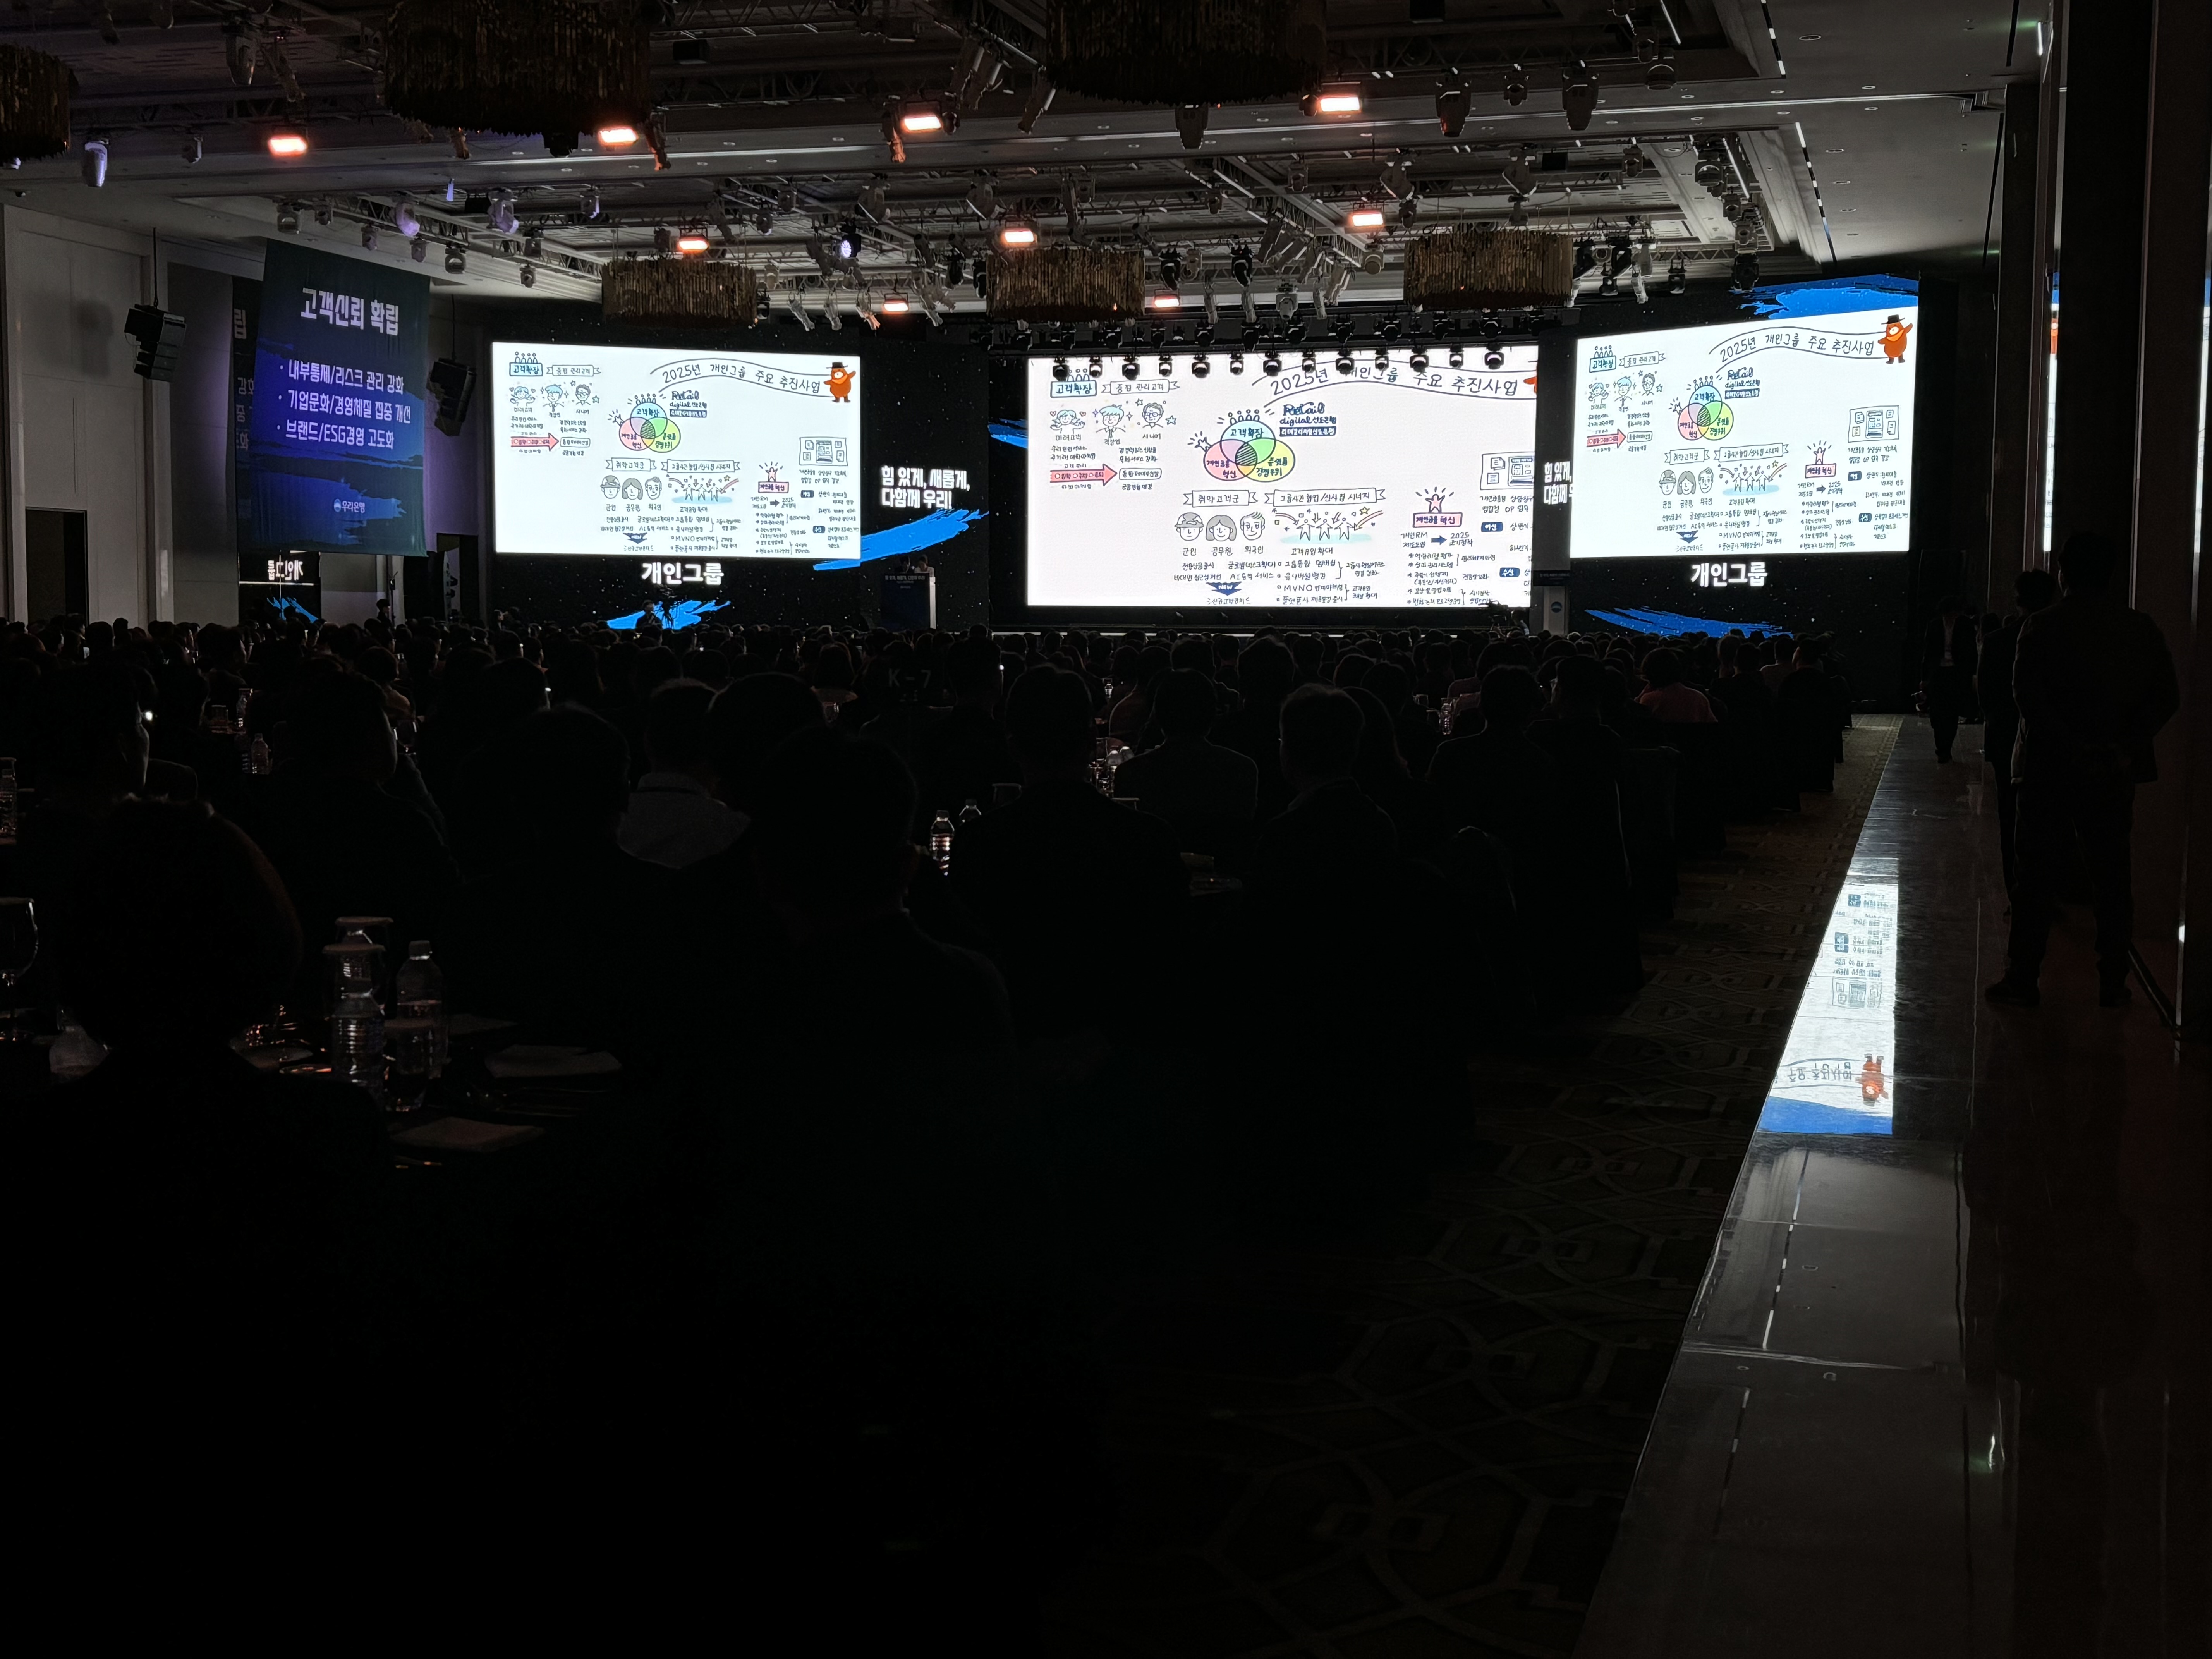
International conferences, corporate strategy workshops, government deliberation, education settings, community spaces — in all of them, the same thing happens: when visualization begins, the quality of the conversation changes.